Squashing a Multiplex into a Monoplex Using RWR_network_aggregation
Published:
It’s not impossible that you’ll at some point with to collapse down your multiplex network into a multigraph. RWRtoolkit provides two methods of multiplex network aggregation.
Let’s first build a toy multiplex for example:
Toy Multiplex Generation
# a quick function for generating erdos.renyi layers
create_layer <- function(n_vertices, probaility, weights){
  # overwrite letters to contain letter combinations for more options
  EXTRALETTERS <- c(LETTERS, sapply(LETTERS, function(x) paste0(x, LETTERS)))
  layer <- igraph::erdos.renyi.game(n_vertices, probaility)
  layer <- set_vertex_attr(
              layer,
              "name",
              1:n_vertices,
              EXTRALETTERS[1:n_vertices]
            )
  layer
}

set.seed(42)

layer1 <- create_layer(15, 1/5) # will have vertices A - AD
layer2 <- create_layer(10, 1/4) # will have vertices A - O
layer3 <- create_layer(5, 1/3) # will have vertices A - J
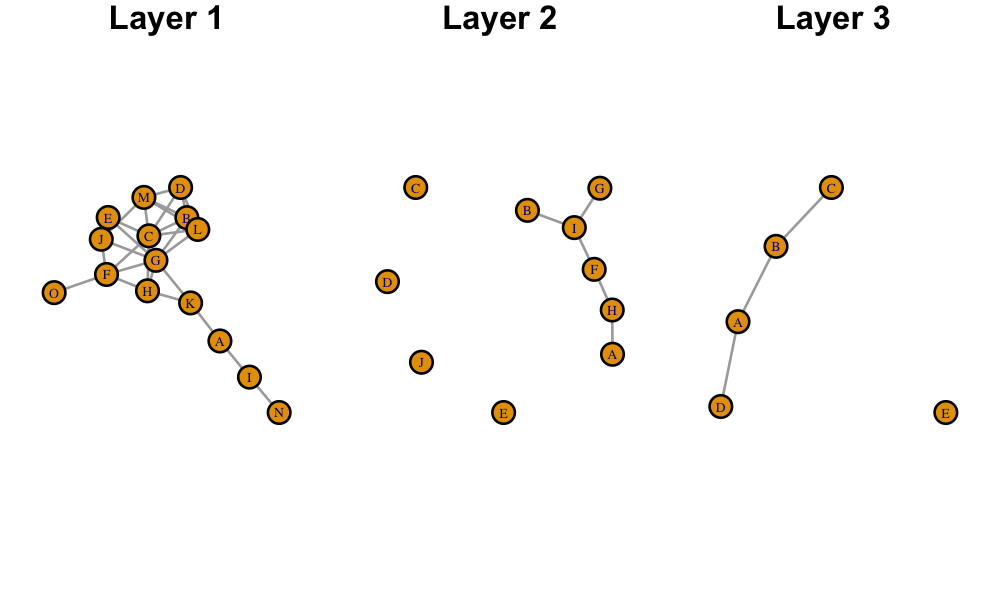
Writing Edgelists
We now have 3 sample networks all with similar vertices, but randomly created edges. We can turn these networks into a multiplex, and additionally, we want our edges to have weights, so we will add an additional vector to their edge lists:
layer1_edgelist <- igraph::as_edgelist(layer1)
layer2_edgelist <- igraph::as_edgelist(layer2)
layer3_edgelist <- igraph::as_edgelist(layer3)


# We need our edges to have weights:
layer1_edgelist <- cbind(layer1_edgelist, rep(1, igraph::ecount(layer1)))
layer2_edgelist <- cbind(layer2_edgelist, rep(1, igraph::ecount(layer2)))
layer3_edgelist <- cbind(layer3_edgelist, rep(1, igraph::ecount(layer3)))

# write to file:
write.table(layer1_edgelist, file="layer1.tsv", quote=F, sep="\t", row.names = F, col.names = F)
write.table(layer2_edgelist, file="layer2.tsv", quote=F, sep="\t", row.names = F, col.names = F)
write.table(layer3_edgelist, file="layer3.tsv", quote=F, sep="\t", row.names = F, col.names = F)
Creating an FLIST
With our files written to a edge lists we can now create an flist file to point to the first three:
file_paths <- c("layer1.tsv", "layer2.tsv", "layer3.tsv")
layer_names <- c("layer1", "layer2", "layer3")
groups <- c(1, 1, 1)

flist_df <- data.frame(list(
              filepaths = file_paths,
              layernames = layer_names,
              groups = groups
            ))

flist_filename <- "./multiplex_flist.tsv"
write.table(flist_df, file = flist_filename, quote = F, sep = "\t", row.names = F, col.names = F)
Creating the Multiplex
Finally, we need to create ou r multiplex to use many of the functions offered within RWR_netstats:
multiplex_filepath <- "./mutliplex.Rdata"
RWRtoolkit::RWR_make_multiplex(
                  flist_filename,
                  output = multiplex_filepath)
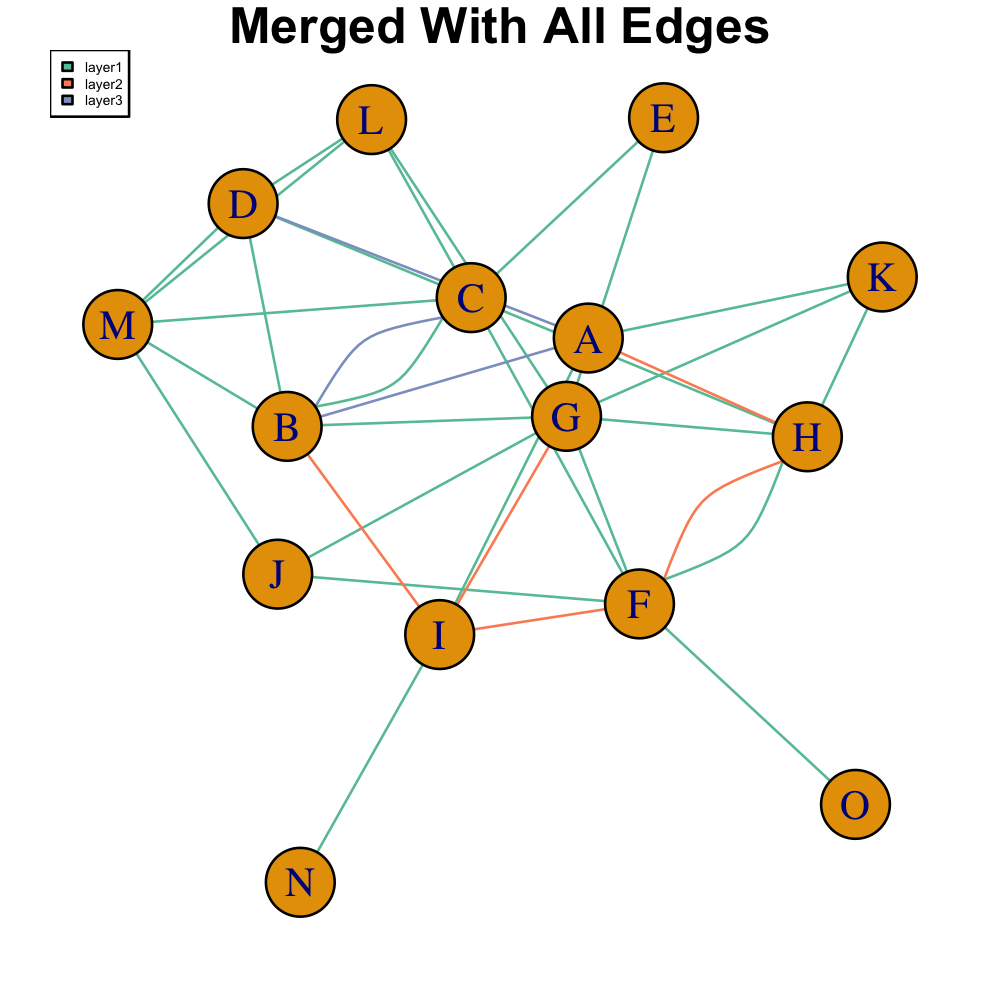
Merging Networks
Collapsing a Multiplex Network
One method of collapsing our multiplex into a single layer maintains all edges between any two nodes A and B, and simply annotates them:
aggregations <- RWRtoolkit::RWR_network_aggregation(
  data = multiplex_filepath,
  merged_with_all_edges = T
)

merged_layers <- aggregations$merged_with_all_edges$merged_network
n_colors <- length(unique(E(merged_layers)$type))
pal <- brewer.pal(n_colors, "Set2")
names(pal) <- unique(E(merged_layers)$type)
E(merged_layers)$color <- unlist(lapply(E(merged_layers)$type, function(x) pal[[x]]))

png('merged_with_all_edges.png', width=1000, height=1000, res=250)
par(mar=c(1,1,1,1))
set.seed(42)
coords <- layout_with_kk(merged_layers)
igraph::plot.igraph(merged_layers, layout=coords, main="Merged With All Edges", vertex.size=18)
legend('topleft',legend=names(pal), fill=pal, cex=1/3)
dev.off()

knitr::include_graphics('merged_with_all_edges.png')
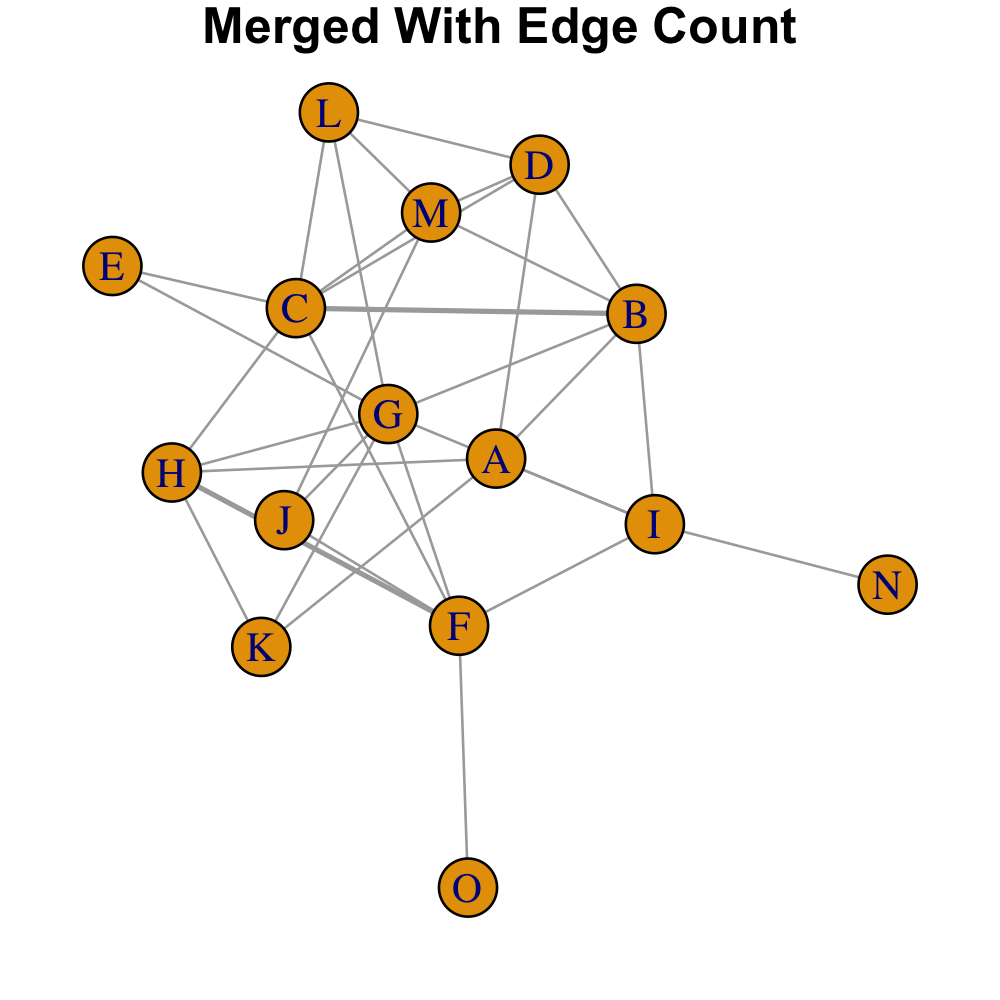
Simplifying a Multiplex
It may also be the case that you wish to simplify your multiplex into a single network, but with only one possible edge between any two nodes. We can do this with merged_with_edgecounts, but in this function, all edge weights between any two nodes i and j are a reflection of how many total edges existed between i and j within the multiplex:
aggregations <- RWRtoolkit::RWR_network_aggregation(
  data = multiplex_filepath,
  merged_with_edgecounts = T
)

edgecount_layer <- aggregations$merged_with_edgecounts$merged_network

png('merged_with_edge_count.png', width=1000, height=1000, res=250)
par(mar=c(1,1,1,1))
set.seed(42)
coords <- layout_with_kk(edgecount_layer)
edge_thickness <- E(edgecount_layer)$weight
igraph::plot.igraph(edgecount_layer, layout=coords, main="Merged With Edge Count", vertex.size=15, edge.width=edge_thickness)
dev.off()

knitr::include_graphics('merged_with_edge_count.png')